Production falls below target
Output is below plan, but the cause may be spread across downtime, machine performance, maintenance events and operator activity. Finding the root cause takes time.

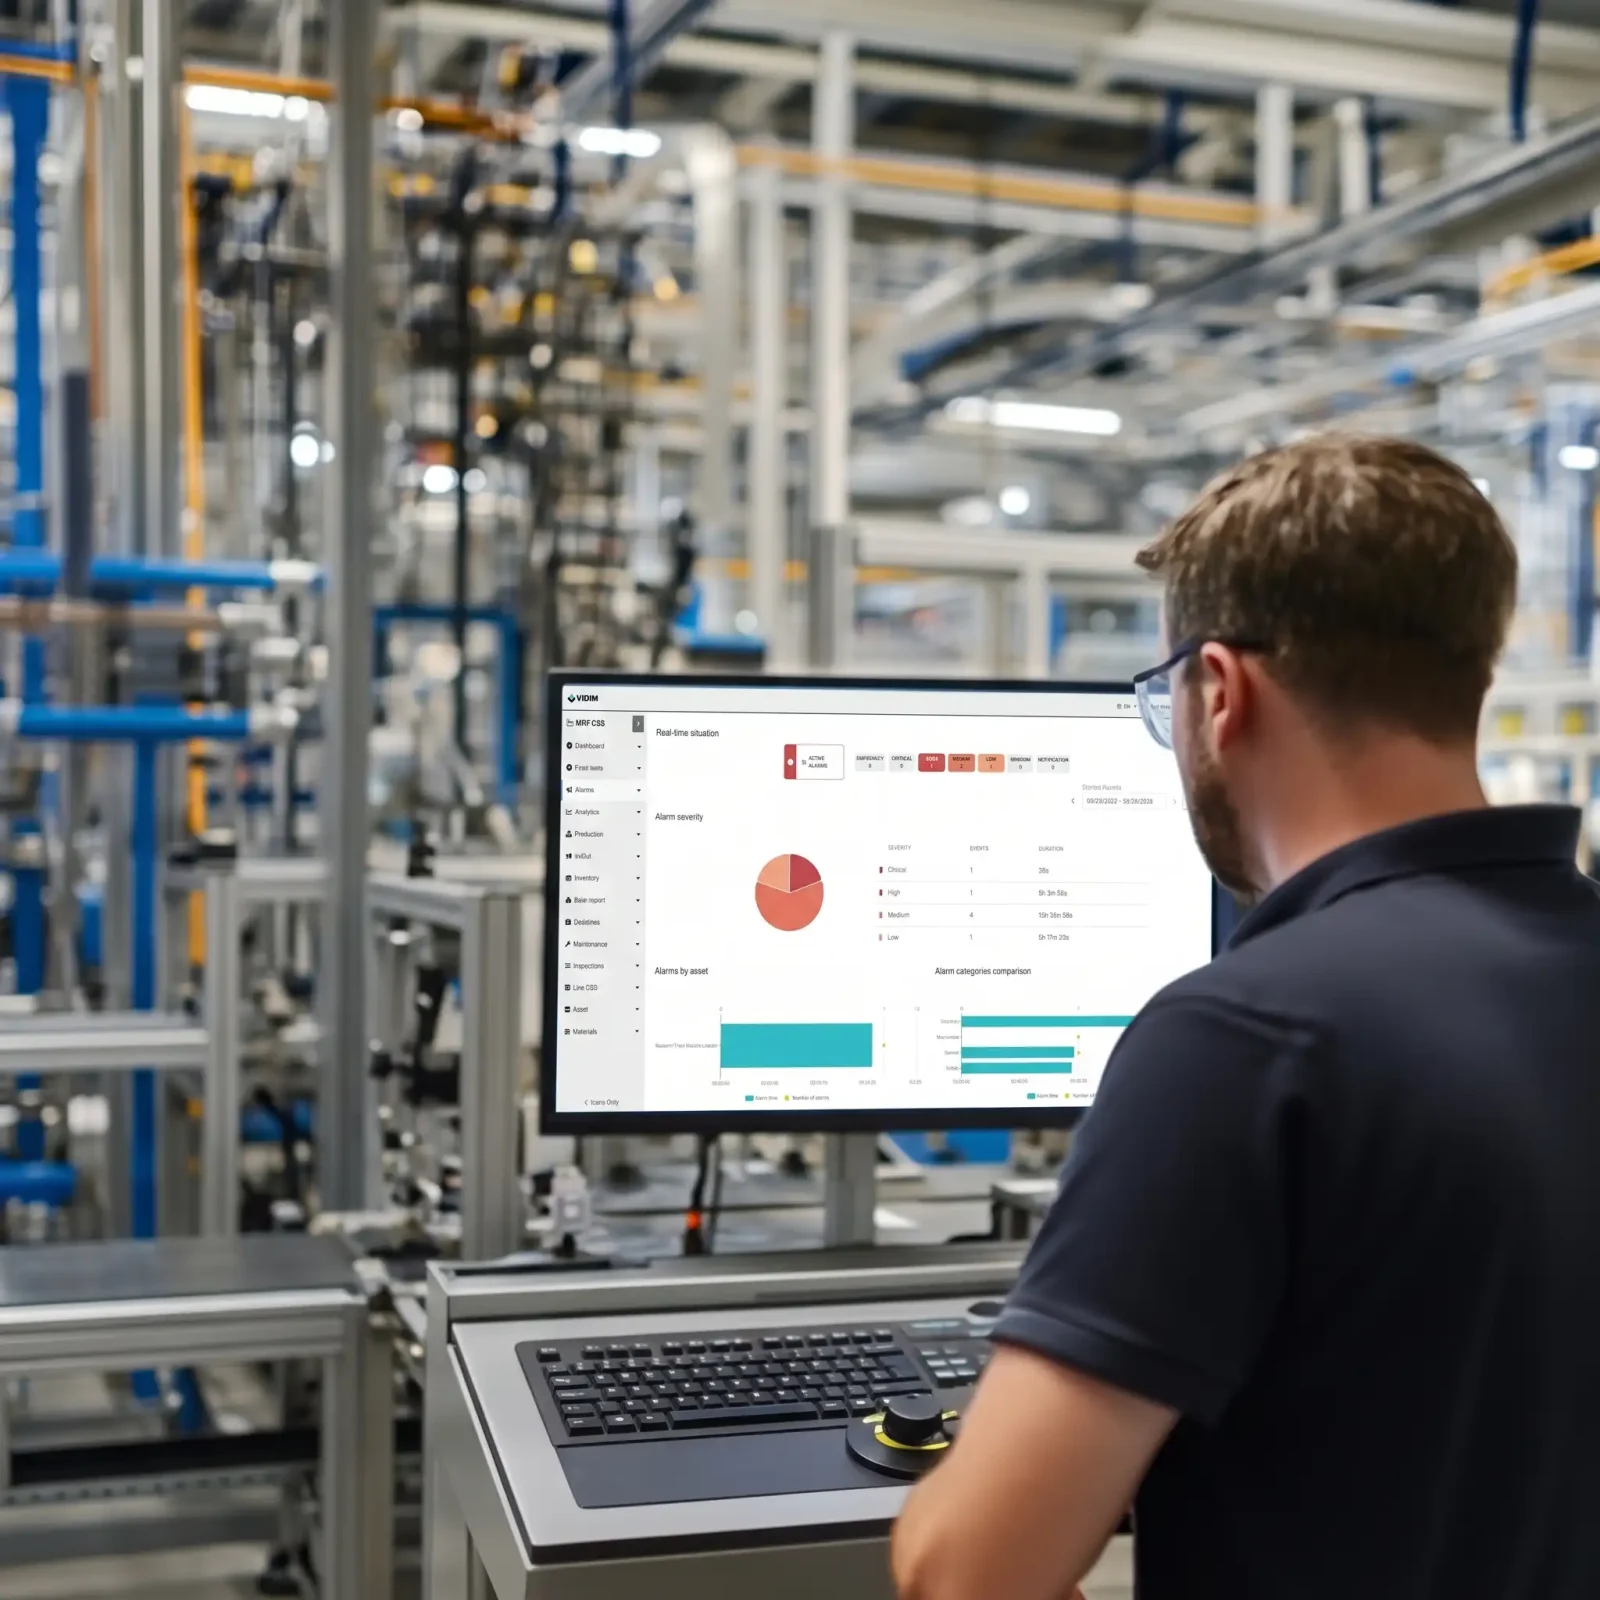
VIDIM brings machine data, operator activity and historical performance together, so teams can see how the plant is performing — and spot what needs attention.
Track trends, detect anomalies and investigate what changed. Use the same connected data to generate consistent reports — without exports, copy-paste and manual reconciliation.


Many plant issues develop gradually, making them difficult to spot before they affect output, quality, costs or reliability.
Output is below plan, but the cause may be spread across downtime, machine performance, maintenance events and operator activity. Finding the root cause takes time.

Changes in temperature, vibration, pressure or recurring downtime can reveal equipment deterioration before a failure occurs. Issues are found too late to prevent avoidable downtime.

Machines and auxiliary equipment can keep consuming power while idle, waiting or running without producing value. The waste often goes unnoticed.

Temperature, pressure, speed, flow and other critical parameters can drift outside acceptable ranges, affecting product quality, damaging equipment or compromising an entire batch.
Machine signals, PLC/SCADA data, meter readings and operator records often sit in separate systems and files. Maintenance teams spend time collecting and reconciling information before they can investigate.
A fault may show what happened, but not why. Maintenance teams must reconstruct the surrounding machine, process and operational context before they can identify the cause.
VIDIM brings machine data and operational context together, so plant performance can be understood in one place. Monitor the indicators that matter, spot deviations as they develop and compare data over time to understand what changed. Get answers to questions such as:
Connect trends and machine conditions with maintenance, events and operator activity to understand what was happening around a change.
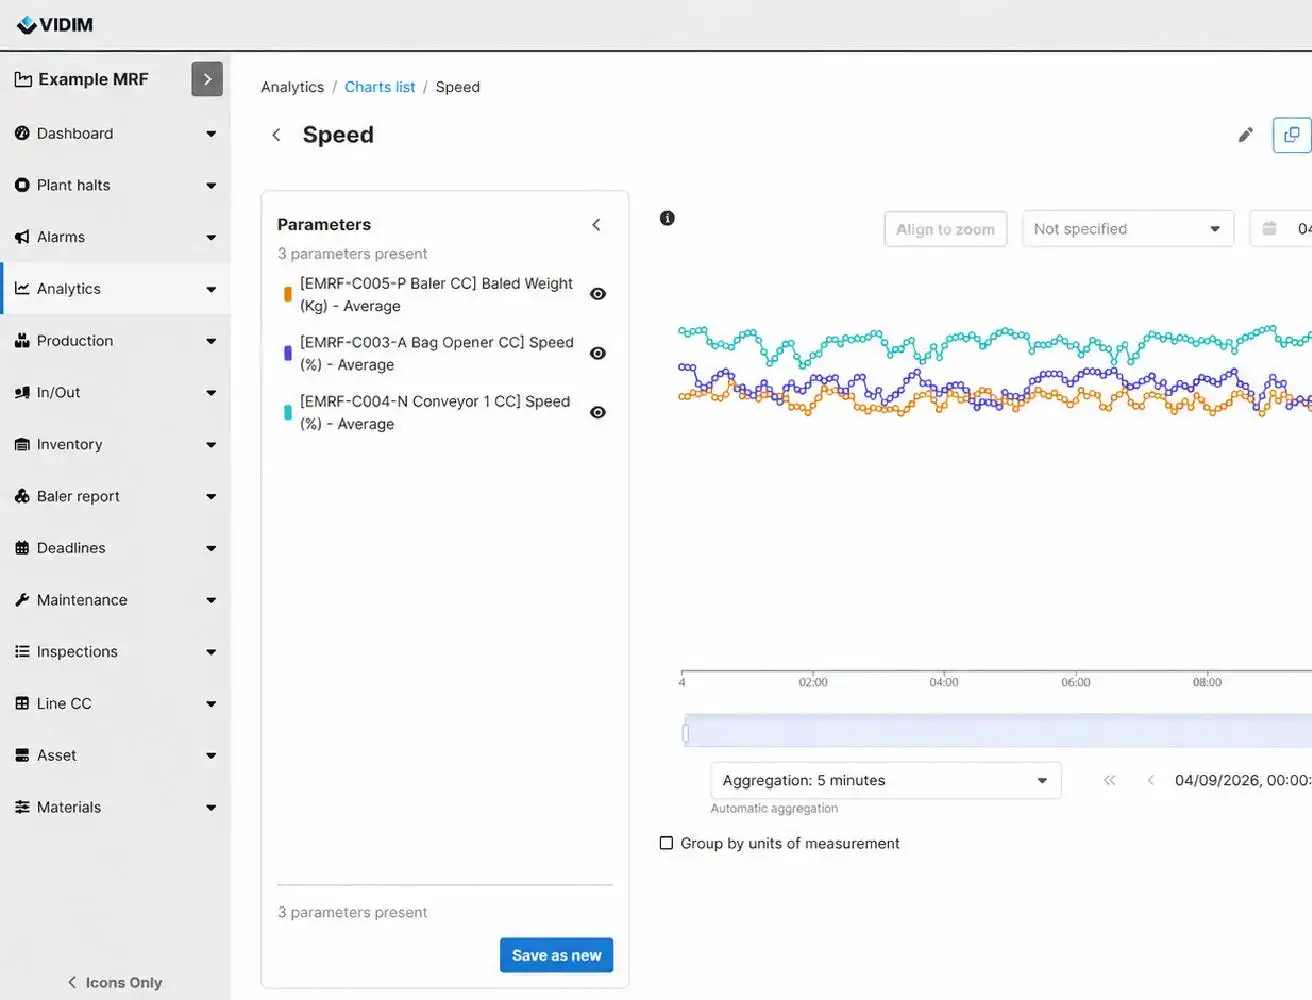
Use condition, usage and trends to adjust maintenance timing and identify developing issues before they become more serious.
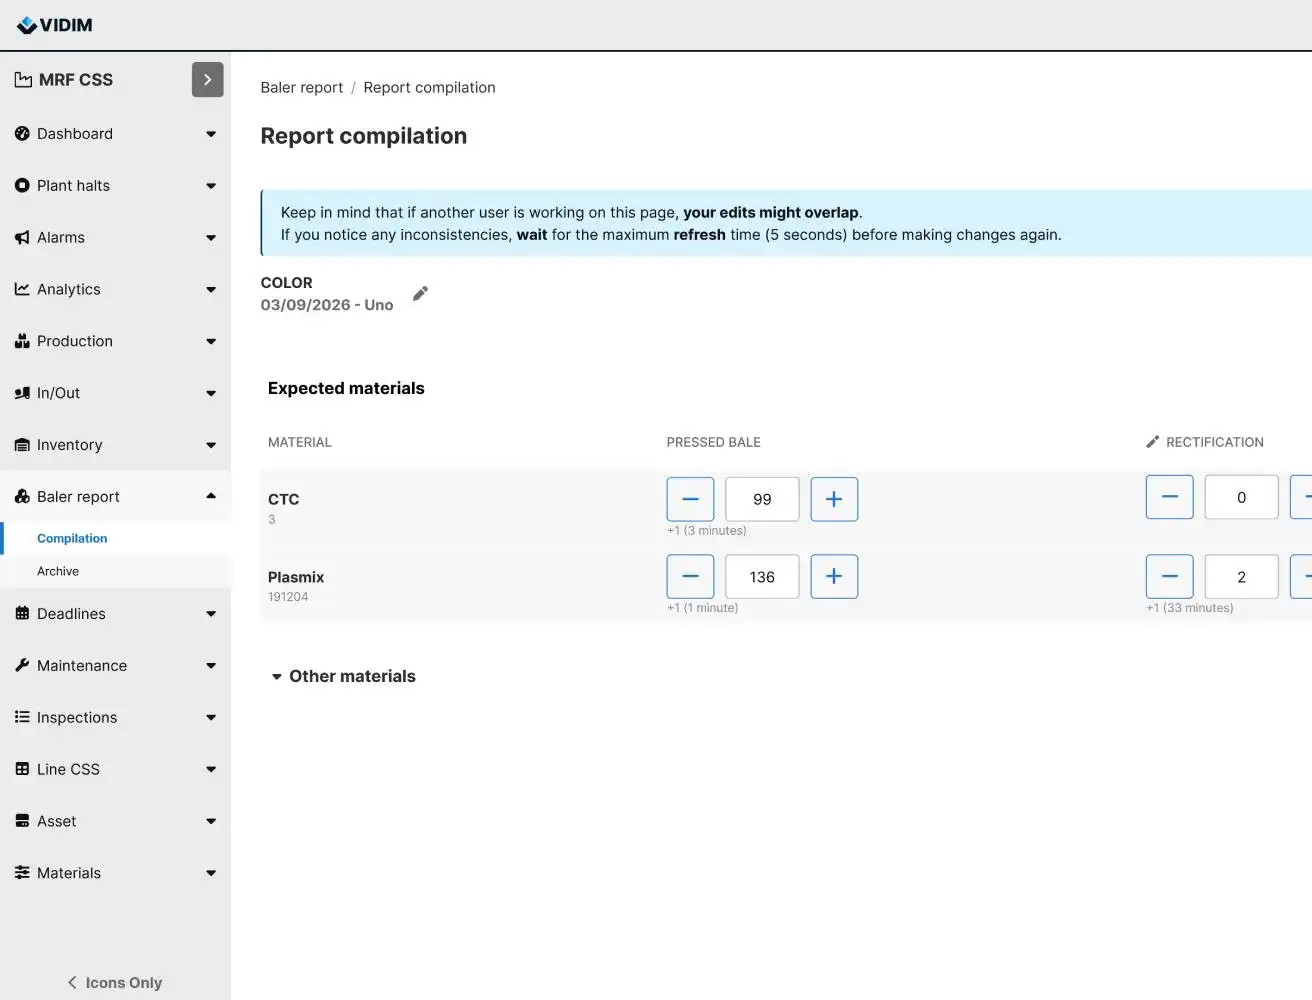
Identify balers, compressors and other energy-intensive equipment consuming power while idle, and uncover opportunities to reduce operating costs.
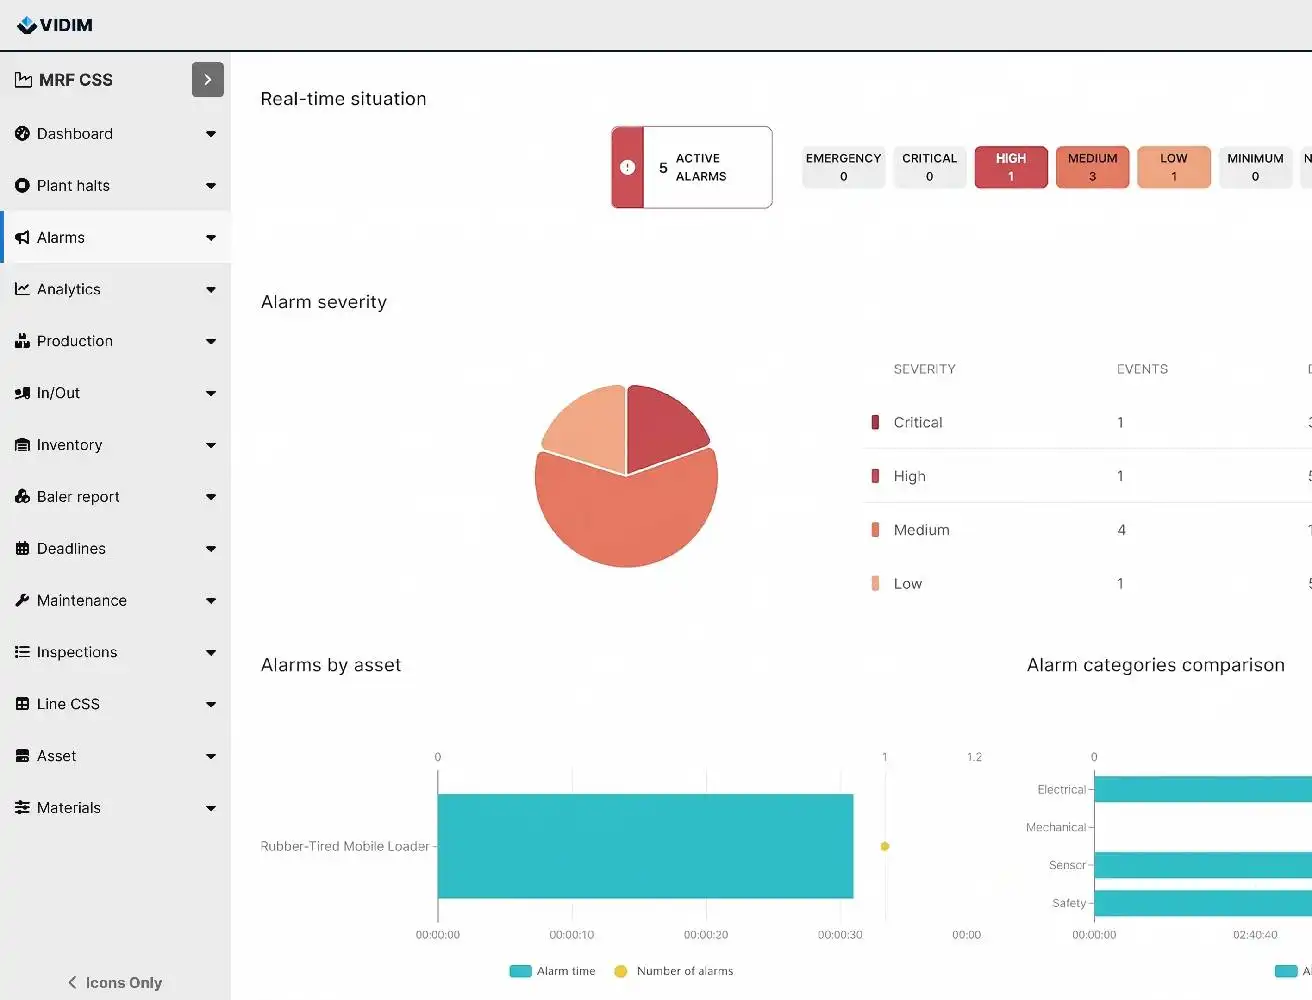
Overlay trends, peaks, alarms, events and maintenance history to narrow the search for causes and focus the investigation.
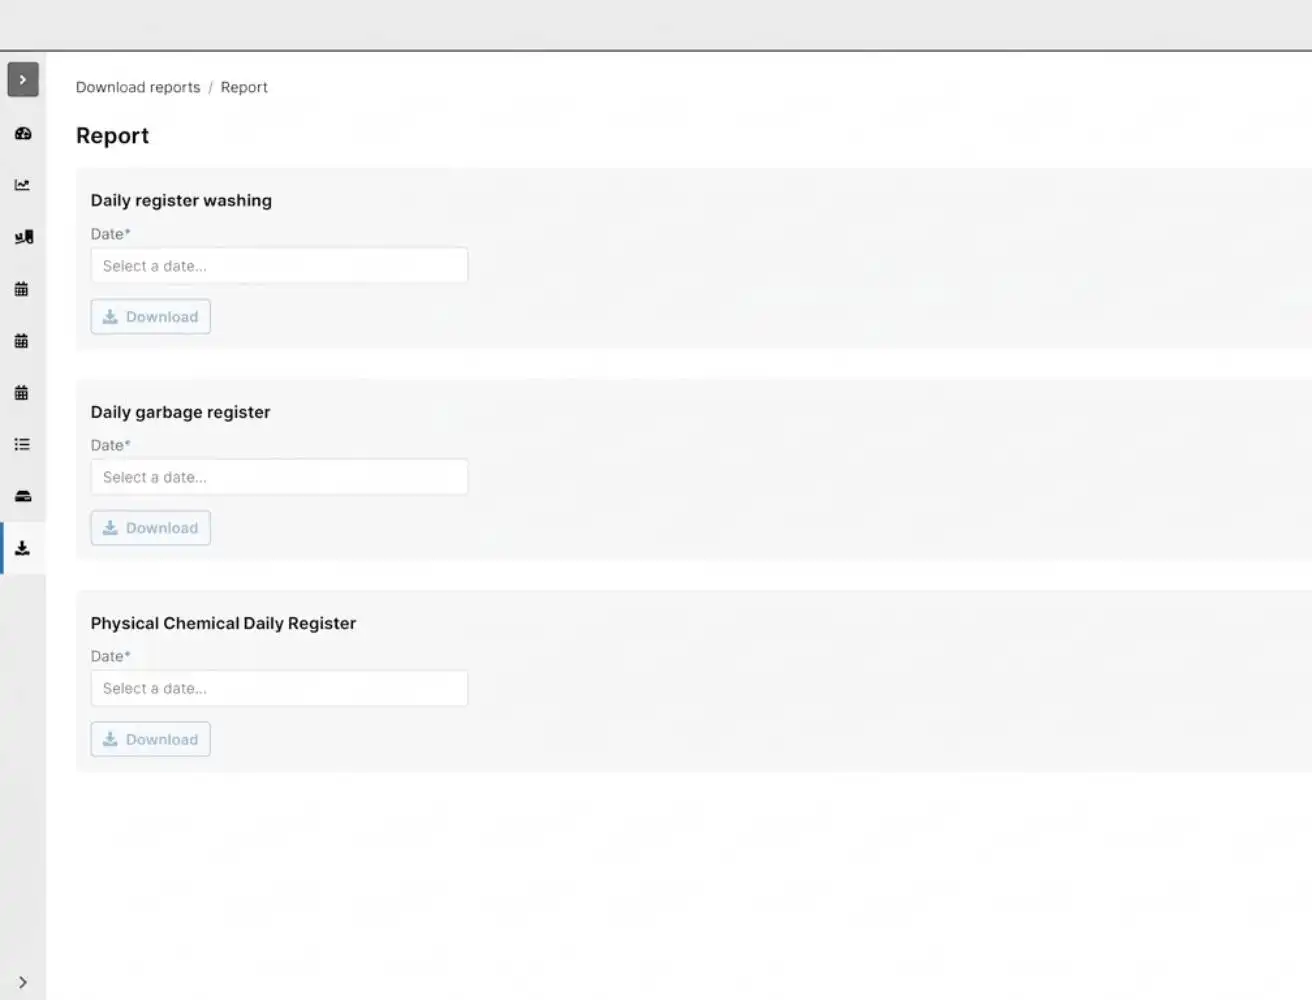
Generate consistent reports from connected data without repeatedly exporting, copying and reconciling information. Keep the source information traceable.
VIDIM connects machine and operational data, keeps it in context and turns it into information teams can monitor, investigate, act on and report from.
Bring machine signals, PLC/SCADA data, meter readings, laboratory results and operator-collected data into one connected operational view.
See live status, KPIs and historical trends. Spot deviations, recurring patterns and slow drift that need attention.
Align machine data, events, maintenance and operator activity on the same timeline to understand what changed together and narrow the search for causes.
Alert the right people and turn findings into maintenance or operational action.
Generate specific or recurring operational and compliance reports from the same connected data used to monitor the plant.
VIDIM connects to existing plant equipment, automation systems, sensors, software and operator-collected data — and can add sensing where information is not yet available.

Machines · PLC · SCADA · DCS · Vehicles · Meters · Existing sensors

ERP · Maintenance Systems · Laboratory Systems · Analytical Tools
VIDIM can extend existing plant data with information collected by operators through the VIDIM mobile app or with additional VIDIM sensors where needed.
Inspections · Readings · Samples · Notes · Photos
Temperature / Humidity · Vibration · Current draw · Smart Camera
OPC UA · MQTT · APIs · Proprietary Equipment Interfaces
Use the same connected data to monitor performance, investigate changes, support compliance, trigger action and report consistently across the operation. Compare performance across sites, assets and processes using consistent KPIs and historical data.

See what is happening now and how performance has changed over time — by asset, process, area or site.

Explore long-term trends, short peaks and recurring deviations to spot changes that deserve attention.

Align machine variables, events, maintenance and operator activity to see what changed together and narrow the search for causes.

Notify the right people when values or patterns require attention and trigger follow-up actions where supported.

Generate recurring operational and compliance reports from connected data, without repeated exports and manual reconciliation.
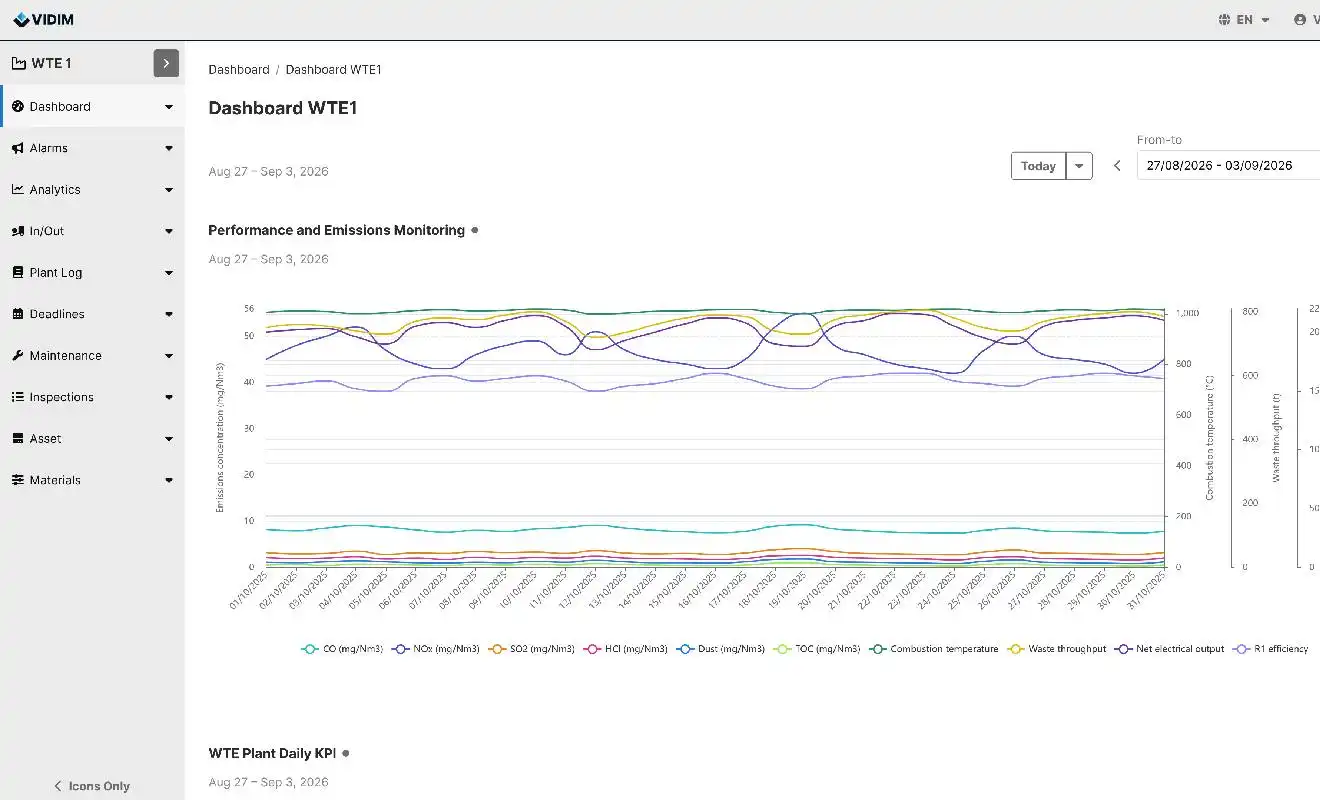
Track combustion, boiler, emissions and energy performance together. Correlate operating conditions with deviations to investigate issues faster and support consistent reporting.
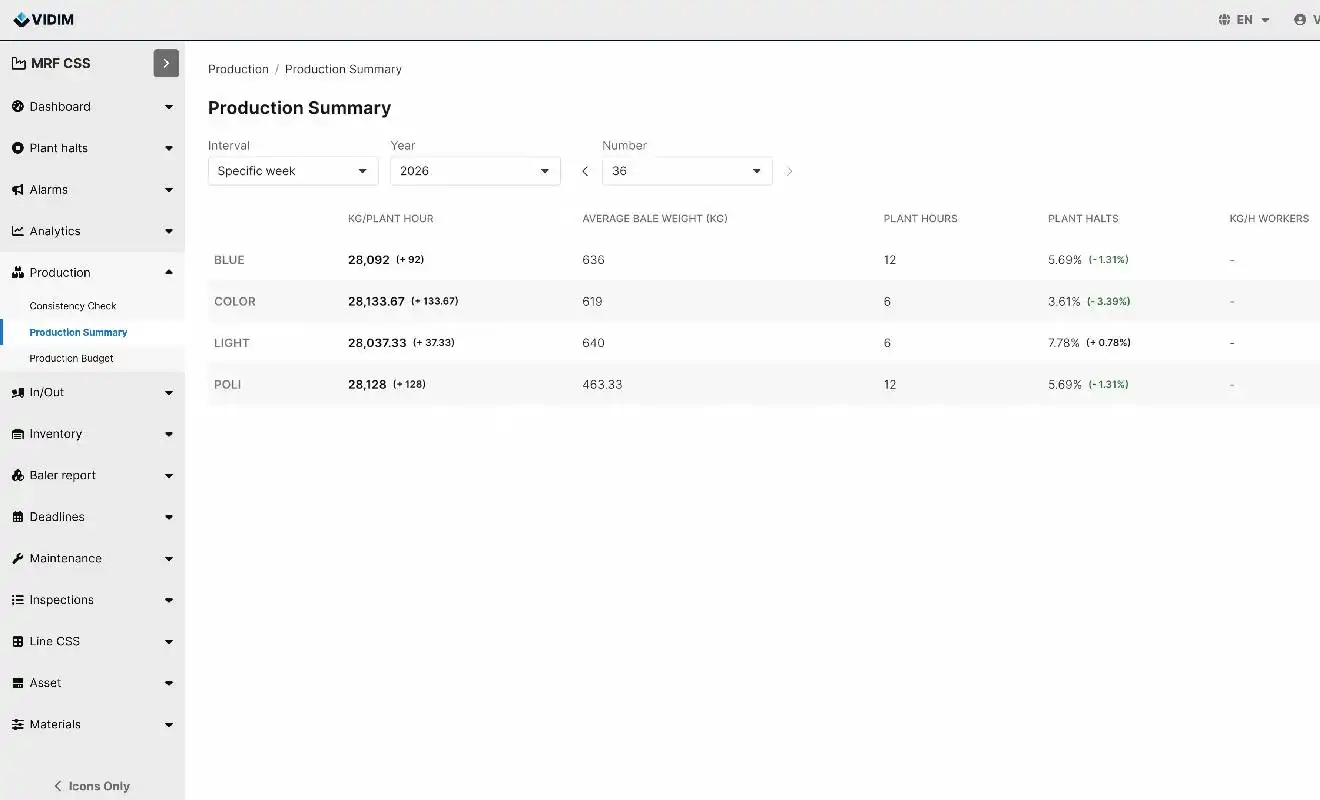
See what is reducing tonnes per operating hour by connecting throughput, line stops, equipment loads, sorting performance and energy use.
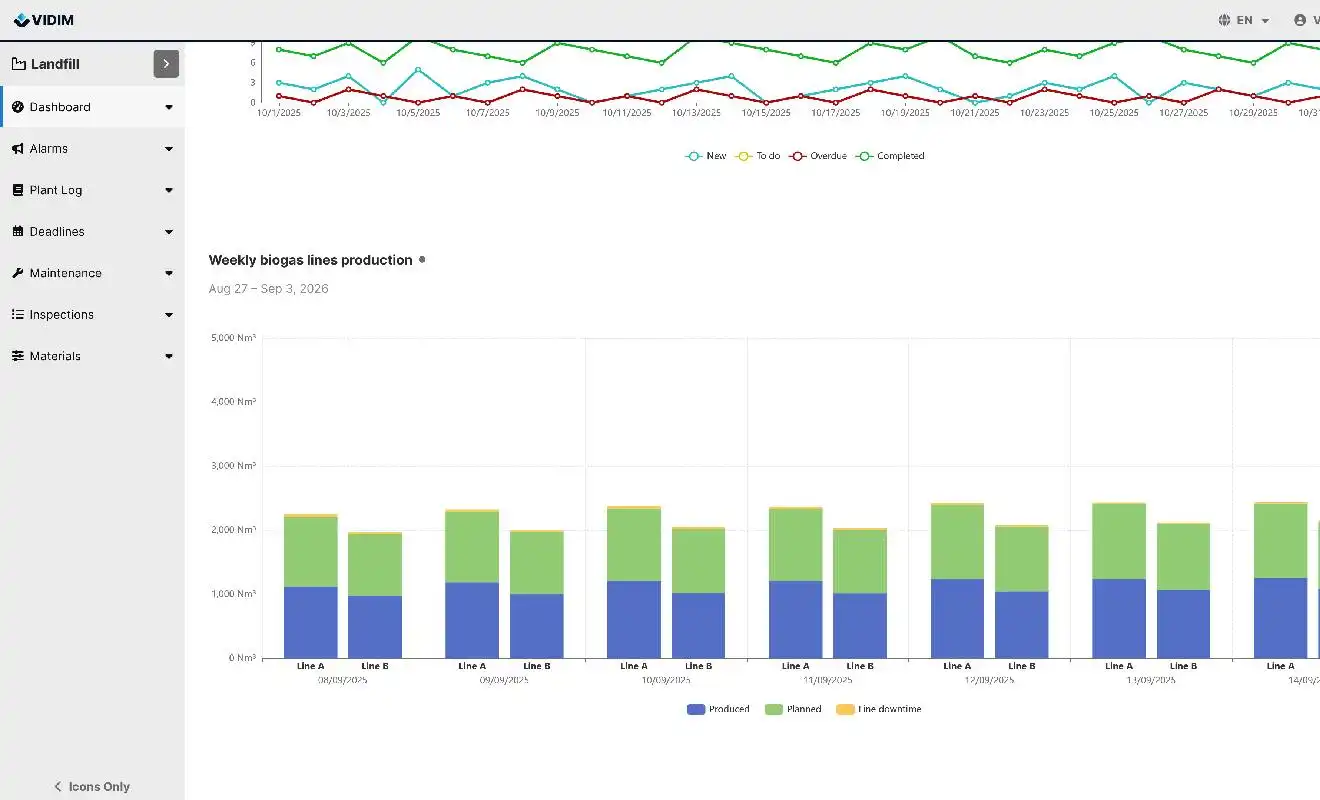
Spot changes in gas production, well-field performance and environmental conditions by comparing readings across zones and over time. Use the same data for recurring reporting.
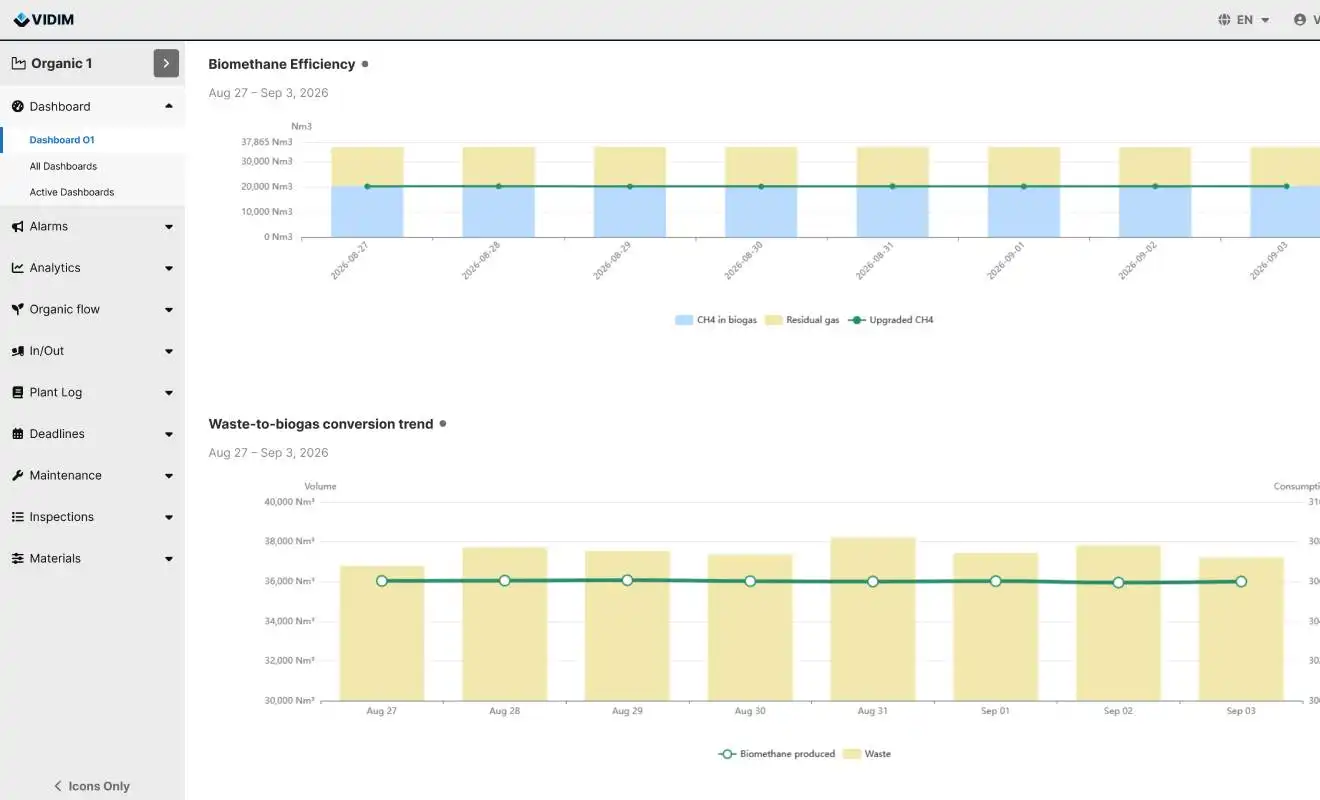
Track feed rate, gas production and quality, temperature, pH and upgrading performance. Spot developing process instability before it affects output.
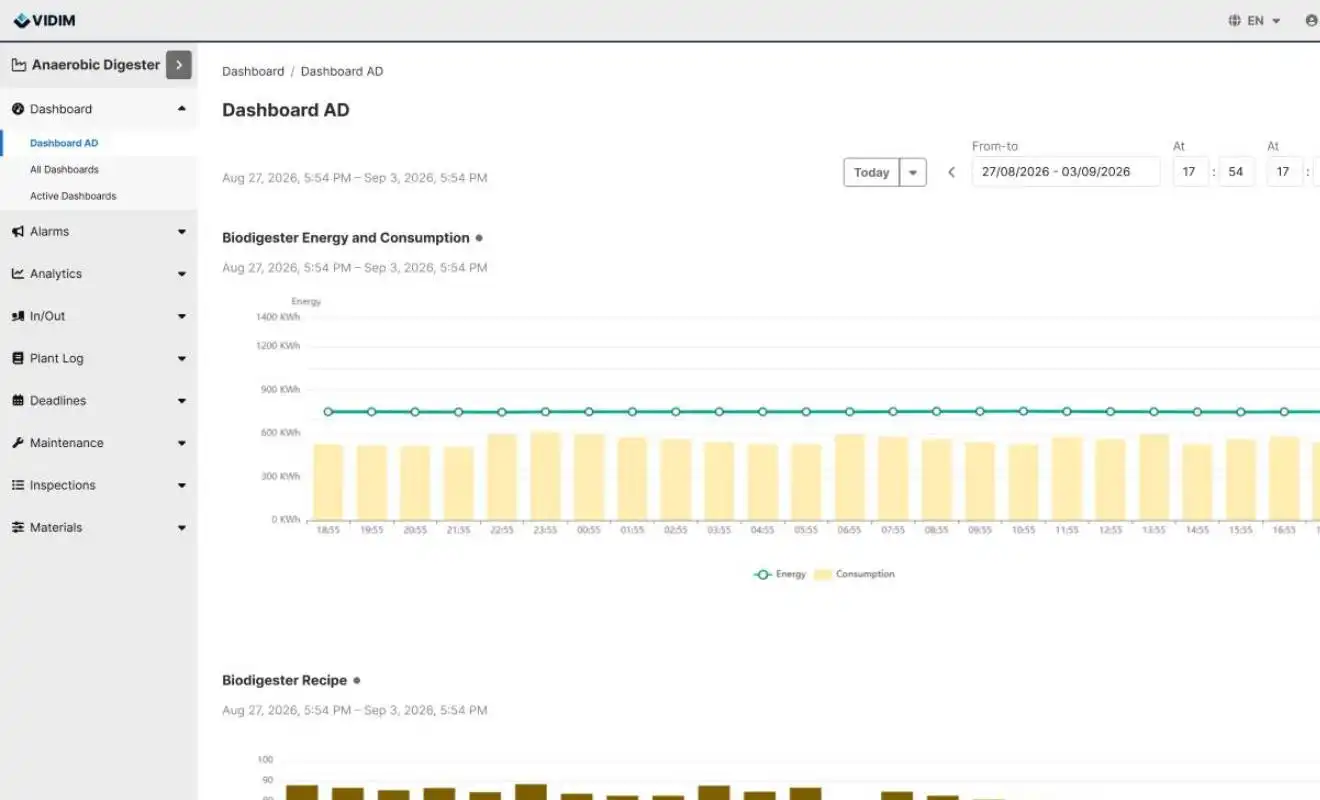
Monitor temperature, aeration, moisture, retention time and other indicators across slow biological cycles. Compare batches and spot deviations earlier.
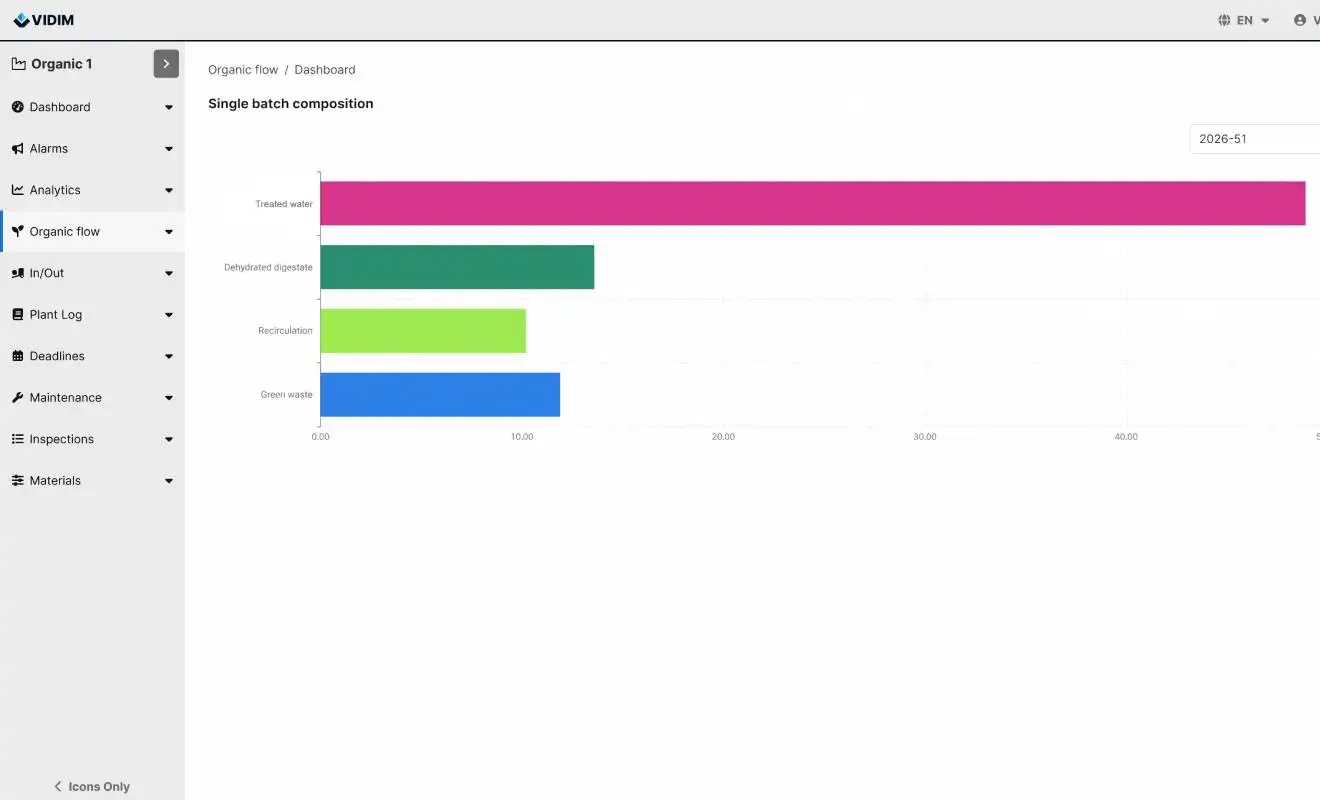
Monitor flows, levels, pumps, dosing and treatment quality. Bring online, laboratory and operator data together to improve process control and simplify reporting.
| Before VIDIM | With VIDIM |
|---|---|
|
Machine and operational data is checked across separate SCADA screens, exports and spreadsheets
|
Connected data is available together by asset, process, plant or site
|
|
Maintenance relies on fixed intervals and individual judgment
|
Condition, usage and trends help teams adjust maintenance timing based on actual equipment needs
|
|
A fault may be visible, but the surrounding context is missing
|
Machine data, events, maintenance and operator activity are aligned on the same timeline to help explain what changed
|
|
Reports require manual exports, copy-paste and reconciliation
|
Recurring reports are generated from the same connected machine and operator-collected data
|
|
Operational knowledge is scattered across systems and individual experience
|
Teams have access to a shared history of assets, events and plant performance
|

“VIDIM gives us complete visibility into plant performance and helps us act before small issues become bigger problems. By tracking downtime and equipment trends over time, we can quickly identify anomalies, detect wear, and prioritize maintenance where it matters most. The result is faster decision-making, more proactive maintenance, and a more reliable plant. ”
Iren Group operates more than 50 facilities. VIDIM has been deployed across its materials recovery and plastics recycling operations since 2023.
VIDIM is built together with the people who use it. As customers expand its use across plants, processes and applications, the platform evolves with their operational needs.
WE'RE PROUD OF OUR 100% CUSTOMER RETENTION ACROSS MORE THAN 50 PLANTS, AND OVER 8 YEARS
Bring machine data, operator activity, trends and reporting together in one reliable view.
Book your VIDIM demo
Choose a time that works for you: the booking calendar opens in a new tab.
The booking calendar could not be loaded — your network may be blocking it. You can still open it directly.
OPEN THE CALENDAR